Kentucky’s non-public students boost overall state scores in new ACT reports
The Bluegrass Institute is always being asked if we have any idea how private school students in Kentucky perform academically.
The answer is, yes, we do have some information. And, that information just got a new update.
And, it shows that private and home school students in Kentucky are doing a really good job.
The ACT college entrance test scores for the graduating class of 2011 were released earlier today, and I’ll be doing a lot of analysis of this very important information.
A few hours ago, I also got a copy of the Kentucky Department of Education’s news release 11-067, which includes ACT scores for graduating public schools students only. Earlier, I obtained the overall average scores for all Kentucky graduates, public, private and home schools combined, from the ACT Profile Summary Report for Kentucky for 2011.
That allows me to do a little algebra to compute how many non-public school students graduated in Kentucky in 2011 and how they did as a group on the ACT.
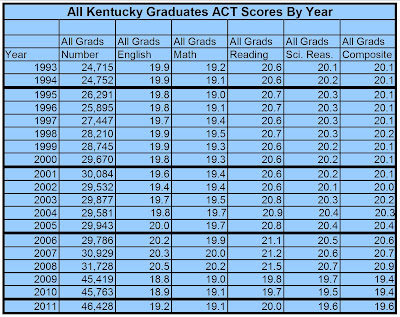
Here are three tables that tell the tale from 1993 to the present.
The first one presents overall results for all students combined. These are scores directly released by the ACT, Incorporated in its reports.

Notice that the overall scores for Kentucky dropped notably in 2009, which is the first year the state tested all students with the ACT. That added about 25 percent of our graduates who had not previously chosen to take the ACT when it was optional, and taken at student cost.
This next table covers public high school students’ performance in Kentucky. These scores come from the Kentucky Department of Education’s news release.

Notice here that our ACT Composite score was 19.1 in 2009, the first year we started 100 percent testing, and dropped to 19.0 the next year. Then, in 2011, we came back up to 19.2. So, our improvement since the first year of 100 percent testing has been 0.1 point. That isn’t a lot to crow about, but it is an improvement.
Finally, this last table covers the performance of the non-public school students. I had to calculate these figures.

There are some very important things to consider here.
First, I have no way to know whether or not the 4,232 students tested in 2011 represent all of the non-public school graduates in Kentucky. However, I suspect that a rather high percentage of the non-public school students in the state do take the ACT.
Second, the number of non-public school students tested dropped slightly from 2010 but still represents nearly a tenth of all the students in the state. That is enough for private and home school graduates to make a notable difference in the all-student scores in the first, blue-shaded table above.
I suspect the private school drop is related to the economic situation.
Next, Kentucky’s non-public students notably outscore our public school students, and the gap has been growing recently.
For example, in 2009 public school graduates had an ACT Composite of 19.1 and non-public school graduates scored 22.1, a difference of 3.0 points.
In 2010, the gap grew to 4.0 points.
For this year’s graduates, the public to private/home school gap enlarged further to 4.4 points.
Thus, in 2009, private school graduates pulled up the public school ACT Composite of 19.1 to an overall average score of 19.4, a difference of 0.3 point.
In 2010, the non-public school graduates’ 23.0 ACT Composite pulled up the public school composite of 19.0 to an overall average of 19.4, a difference of 0.4 point.
Finally, in 2011, Kentucky’s private and home school graduates pulled up the public school average again by 0.4 point.
So, in evaluating only overall scores for Kentucky, it is important to keep in mind that they reflect an important contribution from Kentucky’s non-public school graduates.
When we look at the trend in scores only for Kentucky public school graduates since we adopted 100 percent ACT testing, we have only improved performance by the minimum amount detectable, 0.1 point.
Still, the trend is starting to go in the right direction. This offers hope for the future even though Kentucky clearly has a very long way to go and really needs to look at what is happening in a key charter school state, Louisiana, which I blogged about earlier today.