Those large Kentucky high school graduation rates
One of the bright spots in the new Kentucky education report that came out on October 1 was that high school graduation rates in the state’s schools have risen a bit more and already are high.
But, while the state is handing out more paper to students, does this mean the education level is really improving? Is the graduation rate picture really that bright?
One way to examine these questions is to bring another reported statistic into the equation – the Transition Rate. This shows the percentage of the high school graduates who were able to meet at least one of the numerous ways a graduate can be declared ready for his/her next life transition. That transition might be to college or a living wage job like getting a welding certification.
There are lots of ways to qualify as transition ready, including:
Academic readiness, which can be achieved by performing well enough on:
College Admissions Examination – The ACT
College Placement Examination –KYOTE
Dual Credit Course Completion
Advance Placement (AP) with Appropriate Test Score
International Baccalaureate (IB) with Appropriate Scores
Cambridge Advanced International (CAI) with Appropriate Scores
Career readiness, which can be met with:
Qualifying for Approved Industry Certifications
Career and Technical Education End-of-Program Assessment Passage
Assessment for Articulated Credit (KOSSA)
Career and Technical Dual Credit (Complete six or more hours of Kentucky Department of Education-approved CTE dual credit and receive a grade of B or higher in each course)
KDE/Labor Cabinet-Approved Apprenticeship (TRACK)
KDE-Approved Alternate Process to Verify Exceptional Work Experience
(For more information see the department’s Transition Readiness Web page)
The point is that if a student cannot qualify under any of these Transition Ready criteria, that student very likely didn’t receive an adequate education and is likely to have some real problems in adult life.
So, here is how we compute what we at BIPPS call the Transition Ready Graduation Rate, a graduation rate that acknowledges the importance of getting a quality education as opposed to just getting a piece of paper.
We start with the Kentucky Department of Education’s officially reported Four-Year Adjusted Cohort Graduation Rate (ACGR). This basically shows the percentage of entering ninth grade students who graduate on time with their classmates four years later. If a school has an ACGR of 90.0, that means that out of every entering 100 ninth grade students for that graduating class, 90 graduated on time.
Now the Transition Rate statistic, also officially reported by the Kentucky Department of Education, shows the proportion of the graduates (not the 9th graders) that were able to meet at least one of the many ways to be declared transition ready.
Let’s say the same school with the 90.0% ACGR has a Transition Rate of 70%. That would mean that out of the 90 graduates, only 63 graduated with a transition-ready education. The rest might have gotten a lot less education than they will need for a decent adult life.
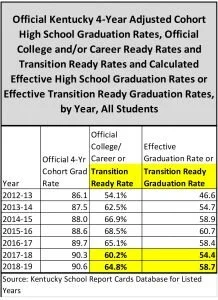
Now, recall we started with 100 ninth graders and now only have 63 of them with real transition readiness. That would be a Transition Ready Graduation Rate (TRGR) of just 63%.In practice, we just multiply the reported ACGR by the Transition Rate (and move a decimal point around) to figure the TRGR.
The table shows how this has worked out over the past two years when the Transition Rate has been in use. The table also shows earlier, similar calculations for the time when the department used a statistic called the College and/or Career Ready Rate, or sometimes just the College and Career Ready Rate, in place of the new Transition Rate.
While the Transition Rate calculation isn’t quite the same as the College and/or Career Ready rate calculation, the comparison is still interesting. And, you can readily see that once we apply the Transition Rate information to the reported graduation rate, the picture for our students doesn’t look good at all. Sure, lots of kids are getting paper, but with a TRGR less than 60 percent, we are losing a really big part of each class either as dropouts or as paper holders who lack the education they need in life.
Stay tuned, because I have also worked up the TRGR for every public high school in Kentucky, and there are some really interesting things going on when the data is broken out in that increased detail.
Data Sources
Click on the data name to access:

