Trends on the ACT college entrance test for private, homeschool, and public school students
The Bluegrass Institute often receives queries about how students attending schools outside the public school system perform academically. It generally has been a challenge to answer those requests because non-public school data isn’t often reported to the public. For one example, absence of specific nonpublic school data has been standard with reports for the ACT college entrance test results. Only overall averages for the total student population, public, private and homeschool combined, have been released by ACT, Inc.
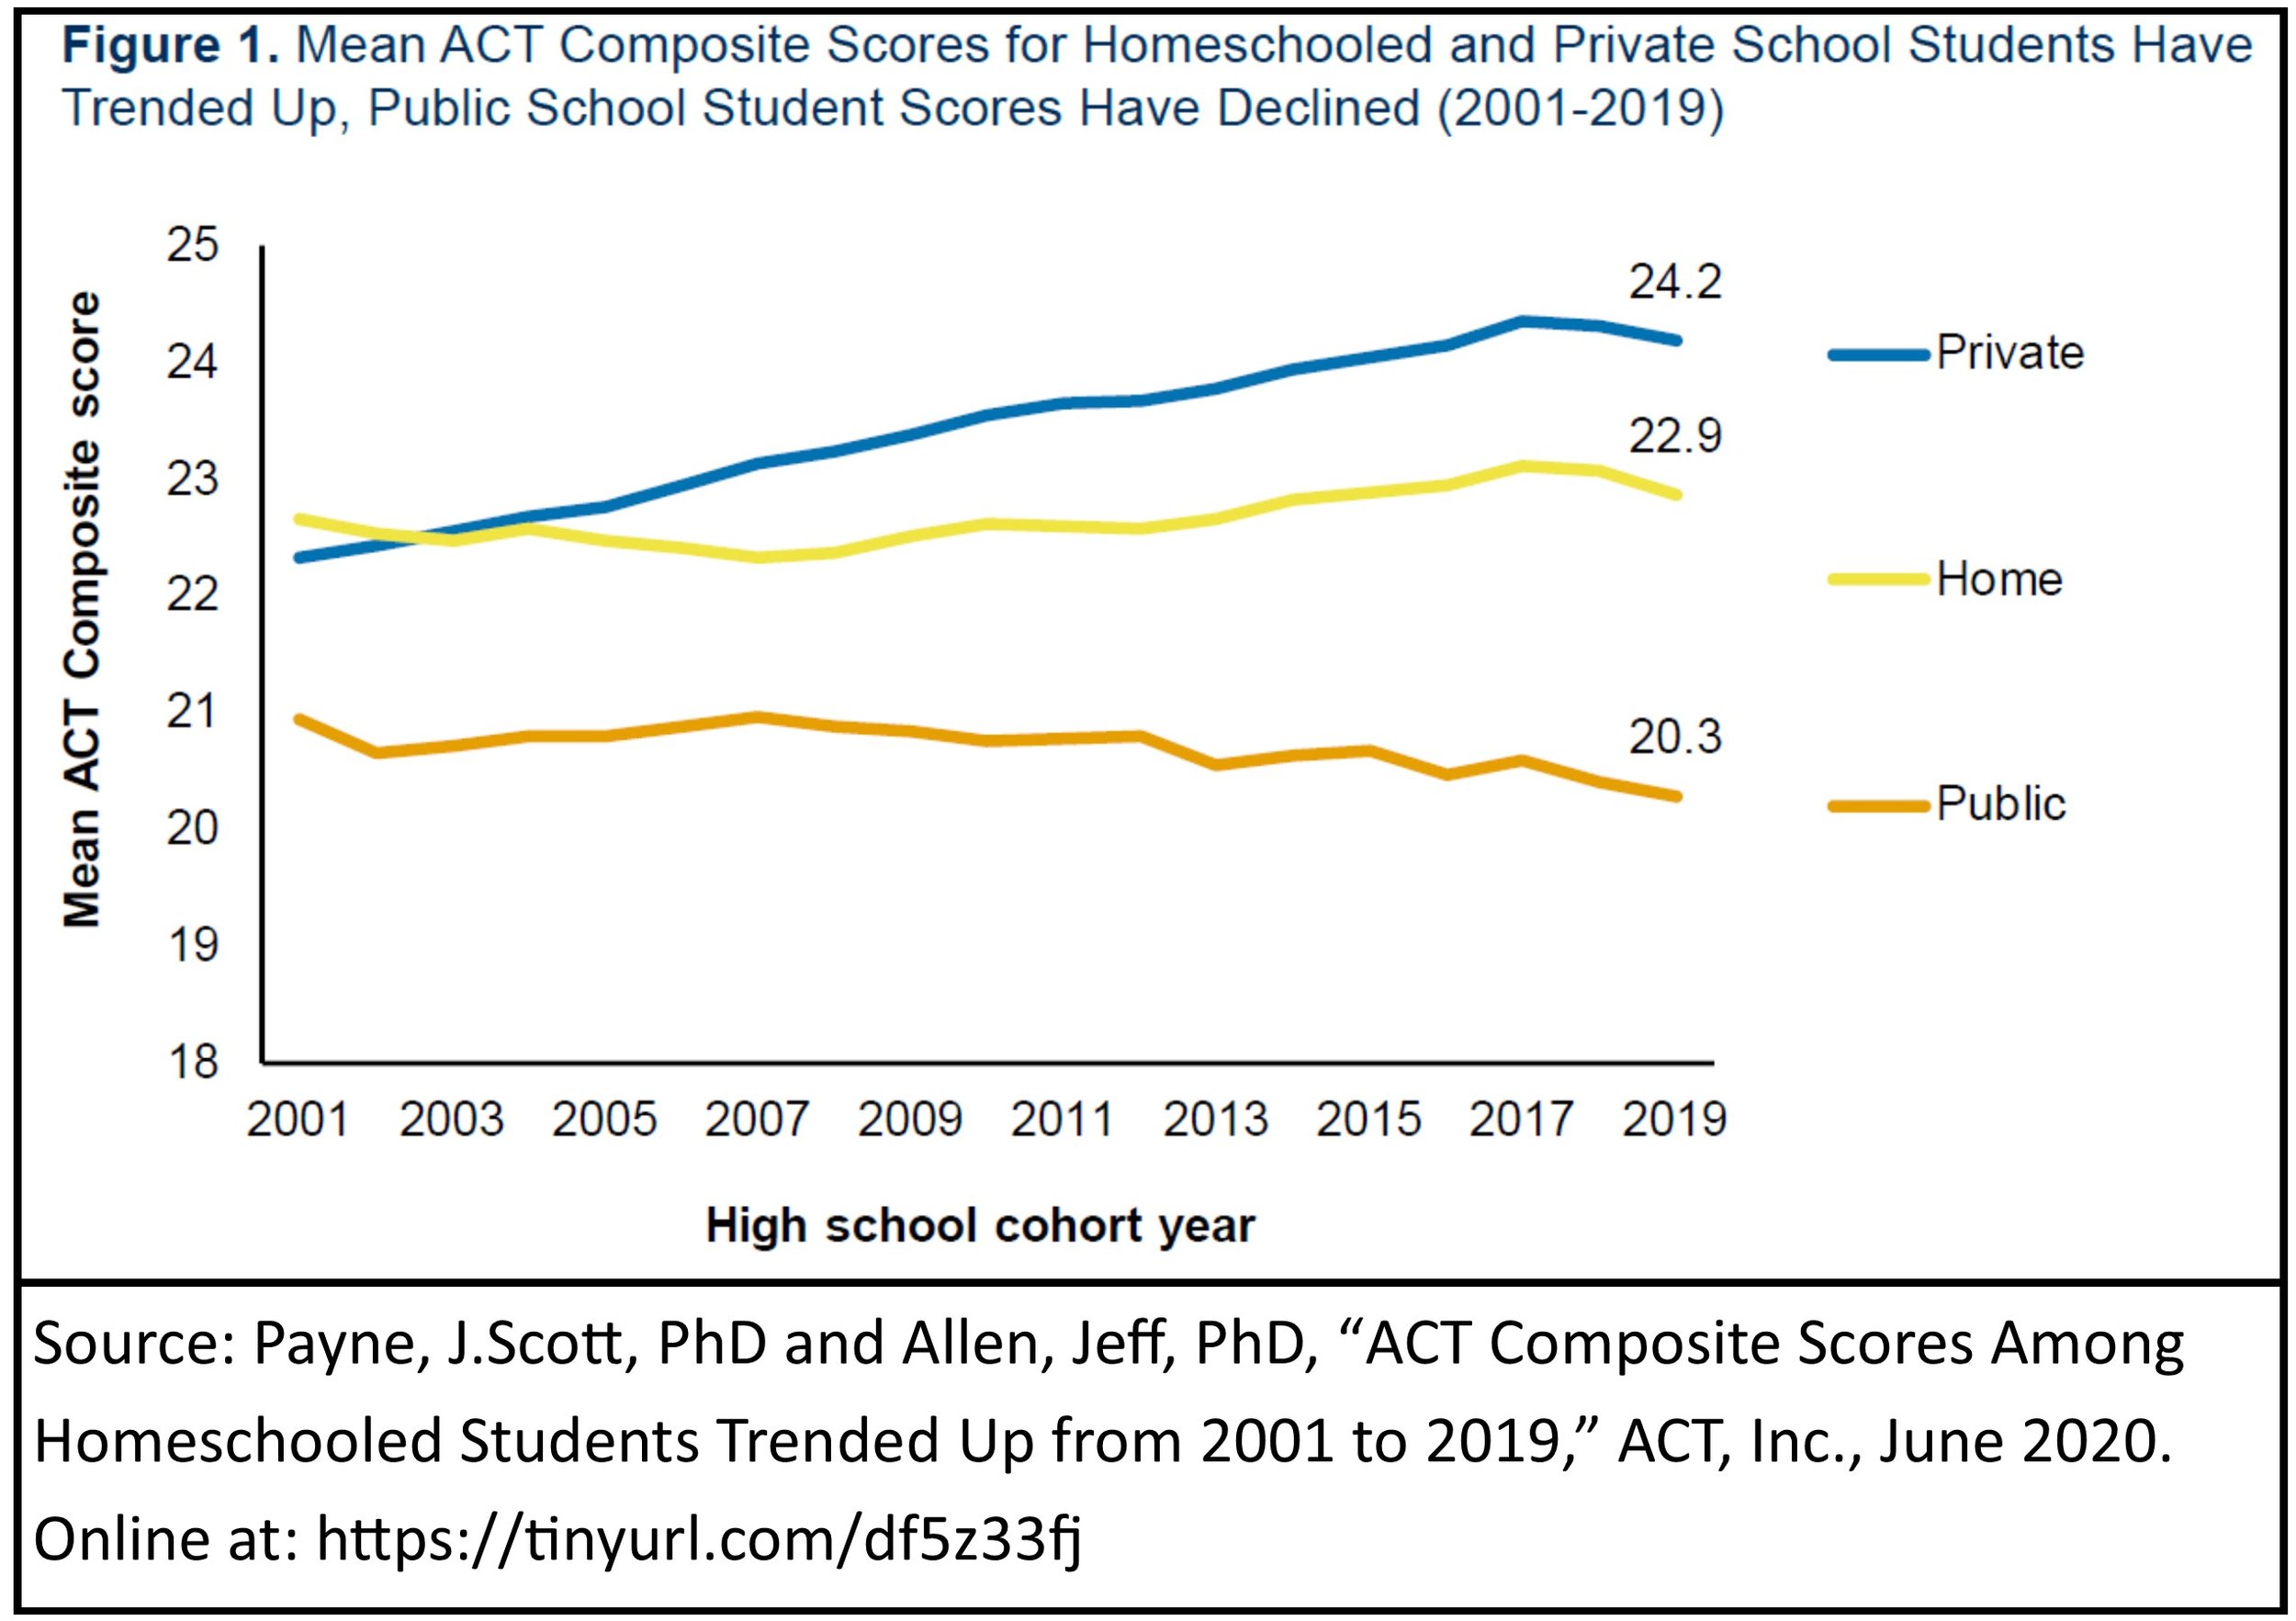
However, we recently learned (Hat Tip to @dmwoof on Twitter/X) about a short report ACT, Inc. issued in 2020 that does have information about how students in different school situations performed on the ACT college entrance test. Figure 1 below comes from that report and shows what ACT researchers J. Scott Payne, PhD and Jeff Allen, PhD found when they separately looked at ACT Composite Scores for students in private schools, homeschools and public schools. This only covers the total national picture, but it is still interesting.
As you can see in the figure, not only are the ACT Composite Scores for private and homeschool students notably higher than the scores for public school students (ACT is a 36-point test), but the title of the figure, supplied by the researchers, also indicates that, at least until recently, mean ACT Composite Scores for private school and homeschool students have been trending up since 2001 but the scores for the public school sector have declined.
Payne and Allen add more in their comments in their ACT “Data Byte” paper. The researchers point out that, “The mean ACT Composite scores for homeschooled students trended upwards from 2013 to 2018 and have been consistently higher than those for public school students, with the difference ranging between 1.4 score points in 2007 to 2.7 score points in 2018.”
However, matching a long-term trend for public school scores, the researchers say, “All three groups have experienced declines in mean ACT Composite score since 2017, marking the first time that scores dropped for all three groups.” This decay in performance began before COVID entered the picture and indicates that something impacting education is hitting all sectors. That’s an area that calls for more research – soon.
By the way, ACT is scored on a 36-point scale so small differences in the numbers can actually indicate considerable differences in performance. Using Table 2.1 in The ACT Profile Report – National for 2020 (I could not find the 2019 report), an ACT Composite Score of 20.5 is at about the 55th percentile of performance while a score of 22.9 is much higher at the 70th percentile and a score of 24.2 is higher still at the 75th percentile for the performance distribution. So, the differences in ACT Composite Scores between public, homeschool and private school are notable.
The ACT’s short paper clearly provides more evidence that offering more children a chance to have nonpublic school education options is in the best interests of both the kids and the country as a whole.
Kentucky’s citizens should keep this information in mind as they head to the polls in November to vote on a constitutional amendment that will enable the Kentucky legislature to offer all families, regardless of income level, better education options for their child. After all, Kentucky is one of very few remaining states with no real school choice options. And, when ACT’s Benchmark Score information indicates that just 23% of the state’s high school graduates in 2023 can do math and only 36% can read at the levels that should ensure success in college, clearly something better needs to happen for the state’s children.

