Kentucky’s education performance ranking at issue again
Senator Higdon conducts “school”
As I previously wrote, educational progress in Kentucky became an issue again during the Kentucky Legislature’s Elementary and Secondary Education Subcommittee meeting yesterday. Kentucky’s supposed education ranking compared to other states was one of the major topics, so it seems worthwhile to explore again some of the rich evidence this blog has accumulated about this important – often poorly researched – area.
In this blog, let’s take an overall look at the misleading pictures that can be created when state education systems are only ranked on overall average student scores. The statistical trap involved even has a name, “Simpson’s Paradox.” Kentucky State Senator Jimmy Higdon got to conduct a little “school” about Simpson’s during the legislative meeting for presenters from the Prichard Committee and the Kentucky Chamber of Commerce. Prichard and the Chamber scored “Novice” on this important math lesson when they created their new paper, “A Citizen’s Guide to Kentucky Education.”
A major challenge in ranking state educational performance is that you can't develop a fair picture by only looking at overall average student scores. Several factors are involved, but one of the most important is that student demographics such as the percentages of racial minorities and poverty rates now vary widely from state to state. In the case of the Bluegrass State, if you only examine overall average scores, you inevitably wind up with inaccurate snapshots that compare whites from Kentucky to lower-scoring racial minority students elsewhere.
Add in the fact that the achievement gaps remain severe between whites and the racial minorities, and a state like Kentucky that still has a strongly white population in its school system gets an unfair advantage if only overall average scores are compared between states.
This isn’t news. Every report card since 2005 from the National Assessment of Educational Progress (NAEP) has pointed this out; if you want a fair impression about relative state education performance, you have to focus beyond the overall average student scores.
Still, many continue to ignore this important advice from the National Center for Education Statistics. Could that be, perhaps, because the real message that results from better analysis isn’t what some folks want to convey?
Anyway, how about a real world example of how the ranking picture is out of focus if you only look at overall test scores? One of my favorites is a comparison of ACT performance for Kentucky’s 2015 high school graduates’ to ACT results in Charter-School-Rich Louisiana. This comparison is reasonable because both states tested all their high school graduates in the Class of 2015.
Check out this table, which summarizes data published in Table 1.5 in the 2015 ACT Profile Reports for Kentucky and the separate report for Louisiana.
The top row in the table shows the overall average scores for “All Students,” which includes information for all 2015 graduates of each state’s public, private and home school programs combined. Kentucky’s overall group of 49,538 graduates in 2015 indeed notably outscores Louisiana’s 49,082 high school graduates in the All Student area, 20.0 to 19.4.So, some would tell us, “Isn’t Kentucky’s 2015 ACT Composite Score average for all graduates of 20.0 notably better than Louisiana’s 19.4? Doesn’t that prove Kentucky does better?” Essentially, that is the approach with the rankings cited in the Prichard/Chamber paper.
However, the overall average scores hide something very dramatic. Let’s look deeper.
Refer back to the table and take a look at what happens when we break the data out by race. As shown by the table cells highlighted in yellow, Louisiana outscores Kentucky for every separate racial group the ACT lists with the lone exception of the very small numbers of Native Hawaiians/Other Pacific Islanders found in each state.
Now who looks like the education winner? Obviously, it is Louisiana.
The only reason Kentucky looks like a winner when we only look at the overall average score for “All Students” is because Kentucky has a lot more white students than Louisiana. Thanks to the grim racial achievement gaps found in the table above, if we only consider overall scores, Kentucky looks better. But, this is only because the Bluegrass State has a lot more white students. The way the mathematics of averaging works out, we get a false picture from the All Student scores.
By the way, if the student racial mix in Louisiana simply had the same proportions found in Kentucky, I calculate that Louisiana’s average ACT Composite Score would be 20.4, notably higher than Kentucky’s.
So, as mentioned earlier, Senator Jimmy Higdon got to conduct a little “school” about Simpson’s Paradox for the presenters at yesterday’s legislative meeting. Sen. Higdon knows the statistics Prichard and the Chamber are pushing fall right into the Simpson’s trap, but he is one smart legislator who isn’t getting caught.
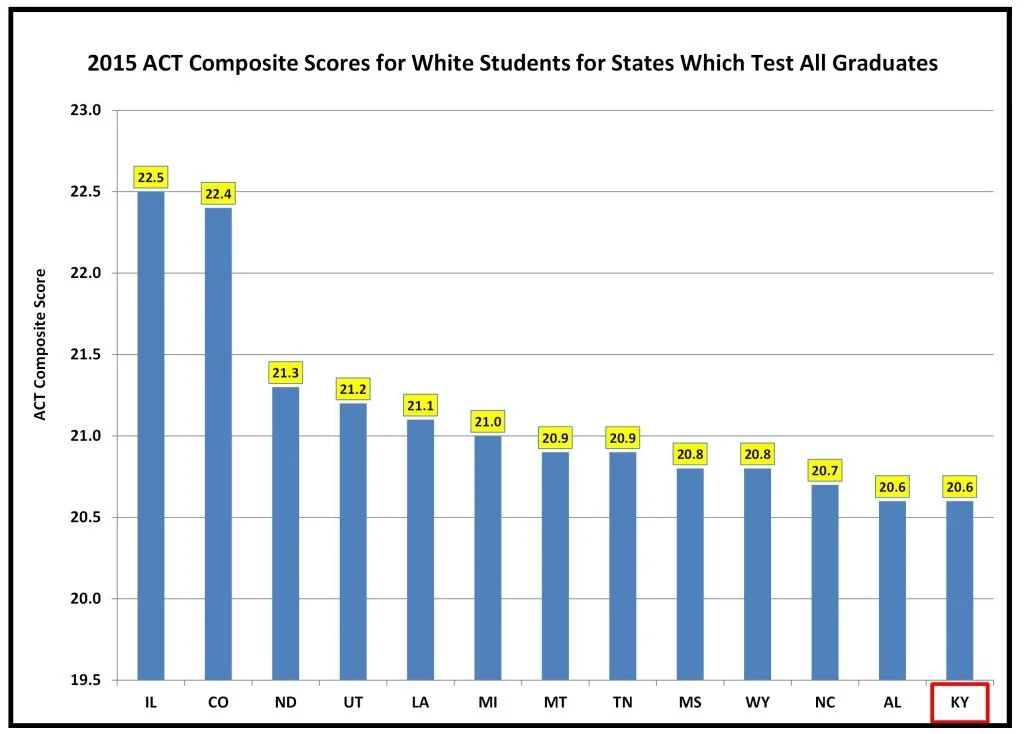
While we are on the subject of the ACT, a legislator expressed interest in how Kentucky compared to other states. This was improperly examined in one of the rankings reports cited in the Prichard/Chamber paper, by the way. So, now that you know about Simpson’s, here is another reasonable comparison of Kentucky’s white 2015 high school graduate ACT performance to whites in those other states that also tested all graduates with the ACT.
After 25 years of KERA, there we are, dead last.
By the way, after Sen. Higdon conducted class on Simpson’s Paradox, other legislators expressed interest in seeing breakouts of scores for the NAEP, as well. Prichard’s Brigitte Blom Ramsey replied they would have to dig that data up. Well, our regular readers know we’ve already been mining that data for years, so in the next blog I’ll look at some NAEP breakouts.


