What the new high school graduation and readiness rates really tell us
The new Unbridled Learning release includes the Kentucky Department of Education’s new graduation and college and/or career readiness numbers. Our regular readers know we’ve been critical of those high school graduation and college and/or career readiness rates for some time. Very simply, there is compelling evidence that both rates are inflated, though in different ways.
This blog will check that out. Basically, we show that the effective high school graduation rate for Kentucky in 2015 is less than 60 percent, which means somewhere on the order of 21,266 kids who should have graduated in 2015 either dropped out of school first or only received a hollow piece of paper at their commencement.
Regarding the high school graduation rates, while a better formula to calculate them – the Adjusted Cohort Graduation Rate – was adopted in Kentucky in the 2012-13 school year, the new calculation is not protected from schools socially promoting students all the way to an empty diploma.
As far as the college and/or career readiness rates – as they should properly be labeled – go, there is disturbing evidence that some of the ways students are allowed to qualify as college ready are not rigorous enough. Freshman year grade point averages show many of those students declared ready really are not. These kids have been set up to fail by a system that told them they were ready for regular, credit-bearing college courses.
Let’s use the department’s own data to make it clear that even with their excessively high numbers, as of 2015 Kentucky is still failing an enormous percentage of its children.
To begin, the new 2015 four-year high school cohort graduation rate of 87.9 percent tells us that out of every 100 entering ninth graders in the 2011-12 school year, 87.9 of them received a high school diploma when the class graduated in 2015 (See the 2015 Kentucky School Report Card for the State to find this data).Next, the 2015 Kentucky School Report Card also reports a college and/or career ready rate of 66.8 percent for the most recently completed school year. That tells us that out of those 87.9 entering ninth graders that made it to a diploma, only about two thirds – just 58.7 students per 100 – graduated from school ready for the rest of their lives. This works out to an effective high school graduation rate of only 58.7 percent.
Imagine that – after 25 years of expensive KERA reforms, Kentucky is only preparing something less than 60 percent of its public school students adequately. And, that is based on what many are coming to understand are inflated numbers.
The table below summarizes the graduation rate and “college and career readiness rates,” as the department incorrectly labels them, for the last three years (a full set of earlier data is not available). We can see some progress, but the numbers remain dreadfully low. In addition, it is obvious that the rate of improvement in both the graduation and the readiness numbers slowed notably between 2013-14 and 2014-15.
We need to consider this, as well:
The remaining students from the group that should have graduated in 2015, 41.3 of them out of every 100 entering ninth graders, either didn’t graduate or received only a hollow diploma that does not signal real readiness.
To put some dimension on this, the Kentucky School Report Card for 2012 shows that in the 2011-12 term there were 51,491 ninth graders. So, it looks like somewhere around 21,266 of those students either dropped out before graduation or only got a hollow piece of paper at the commencement ceremony. That is an awful lot of kids who are not ready for the demands of life in the new, very technical economy they are being turned loose to survive in.
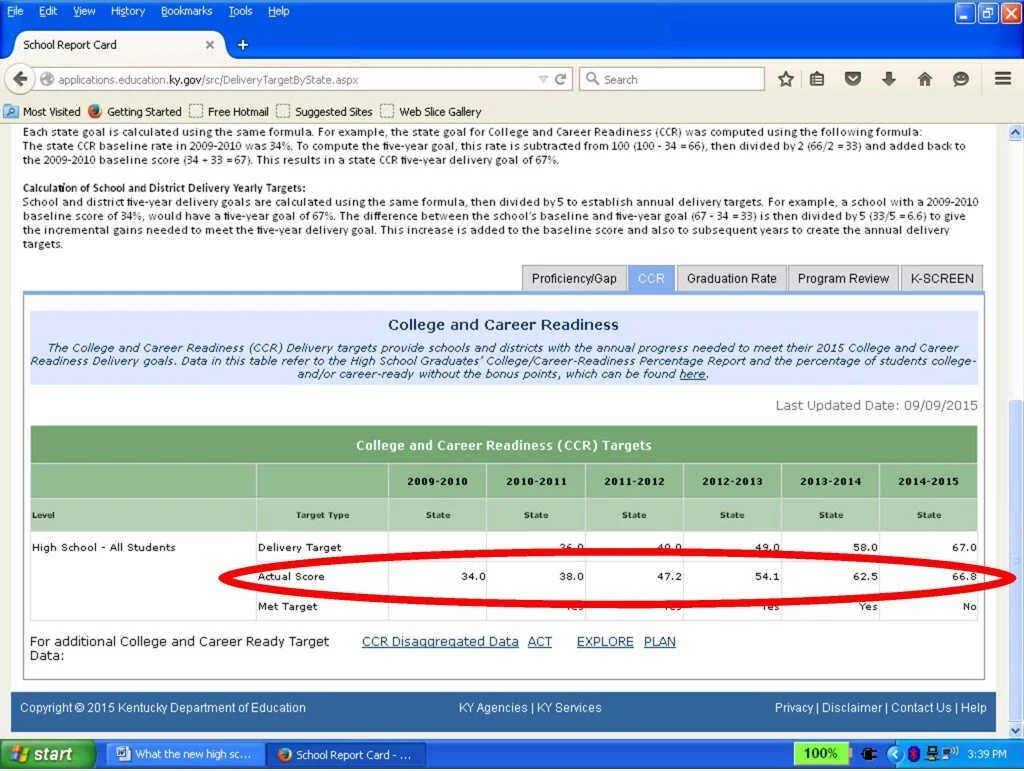
One more point bears mention. Kentuckians are being inundated by the education crowd crowing about the huge increase in the college and career readiness rate. The 2015 Kentucky School Report Card will continue that nonsense. The screenshot below of the report card page with the readiness data presents numbers all the way back to 2010 as though all are comparable. That is absolutely not true. In fact, the numbers for 2010 and 2011 were calculated using a very different formula from the one adopted for 2012 and later years and those early numbers should not be compared to the later data under any condition.
But, when you are trying to create an excessive picture of progress….
In closing, I must reiterate, the examples in this blog are based on the Kentucky Department of Education’s numbers. A lot of folks, including the Kentucky Legislature’s Office of Education Accountability, now believe those numbers are inflated. As such, we actually may have failed a lot more than 21,266 kids.


